
Lab 8: Creating the Mandelbrot Set
The Mandelbrot Set
In this lab you will build a program to visualize and explore the points in and near the Mandelbot Set. In doing so, you will have the chance to:- Use loops and nested loops to solve complex problems (quite literally!)
- Develop a program using incremental design, i.e., by starting with a simple task and gradually adding levels of complexity
- Connect with mathematics and other disciplines that use fractal modeling
Introduction to for Loops!
Because you will create images in this lab, there is some additional starter code—grab and unzip hw8pr1.zip. Here is hw8pr1.zipTrying things out -- and making sure you have the Pillow library...
- First, extract that hw8pr1 archive into a folder, and then cd into your hw8pr1 folder.
- Next, try running the file in the usual way: In [1]: run hw8pr1.py
- Error? No PIL?
Try
- !pip install Pillow or
- !pip3 install Pillow or
- %pip install Pillow or
- %pip3 install Pillow
- Troubles? Let us know and we'll work on it together...
Getting started on the lab...
Next, as a reminder of how loops work, first write two short functions in your hw8pr1.py file:- Write a function named mult(c, n) that returns the product c times n, but without multiplication. Instead, it should start a value (named result) at 0 and repeatedly add
the value of c into that result. It should use a for loop to make sure that it adds c the correct number of times.
After the loop finishes, it should return the result, both conceptually and literally.
The value of n will be a positive integer. To get you started, here is a snippet of the function that initializes the value of result to 0 and builds the loop itself:def mult(c, n): """Mult multiplies c by the positive integer n, using only a loop and addition. """ result = 0 for i in range(n): # you will write this line of code! (Hint: add to result!) return result print("mult(105, 3) should be 315 and is", mult(105, 3))Here are a couple more cases to try:In [1]: mult(6, 7) Out[1]: 42 In [2]: mult(1.5, 28) Out[2]: 42.0
- The next function will build the basic Mandelbrot update step, which is z = z**2 + c for some constant c.
To that end, write a function named update(c, n) that starts a new value, z, at zero, and then repeatedly updates the value of z using the assignment statement z = z**2 + c for a total of n times. In the end, the function should return the final value of z. The value of n will be a positive integer. Here are the def line and docstring to get you started:def update(c, n): """Update starts with z = 0 and runs z = z**2 + c for a total of n times. It returns the final z. """Here are a couple of cases to paste:In [1]: update(1, 3) Out[1]: 5 In [2]: update(-1, 3) Out[2]: -1 In [3]: update(1, 10) Out[3]: a really big number! In [4]: update(-1, 10) Out[4]: 0
Introduction to the Mandelbrot Set
The Mandelbrot set is a set of points in the complex plane that share an interesting property that is best explained through the following process:- Choose a complex number c.
- With this c in mind, start with z0 = 0.
- Then repeatedly iterate as follows:
- zn+1 = zn2 + c
- For the Mandelbrot set, it turns out that abs(z) > 2 is a good-enough check for "diverging"!
There are other, equivalent definitions of the Mandelbrot set. For example, the Mandelbrot set consists of those points in the complex plane for which the associated Julia set is connected. Of course, that requires defining Julia sets...which we won't do here. The Mandelbrot set is a fractal, meaning that its boundary is so complex that it cannot be well approximated by one-dimensional line segments, regardless of how closely one zooms in on it. There are many available references on the topic.
The inMSet function
The next task is to write a function named inMSet(c, n) that accepts a complex number c and an integer n. This function will return a Boolean:-
Trueif the complex number c is in the Mandelbrot set and -
Falseotherwise.
Complex numbers in Python
In Python a complex number is represented in terms of its real part x and its imaginary part y:- The mathematical notation would be x+yi, but
- in Python the imaginary unit is typed as 1.0j or 1j, so that
c = x + y*1jsets the variable c to the complex number with real part x and imaginary part y. - The syntax x + yj does not work, because Python thinks you're adding a variable named yj.
- Also, the value 1 + j is not a complex number: Python assumes you mean a variable named j unless there is an int or a float directly in front of it. Use 1 + 1j instead. (j is a very common variable name!)
Side notes:
- Mathematicians use i to represent the imaginary unit.
- Engineers often use j (in part, because i refers to electrical current, often modeled in the complex plane!)
- (Python follows the engineering convention, perhaps because i is so common a variable name, though so is j...)
- Since a complex number has two parts (real and imaginary), you can think of those two parts as coordinates on a graph.
- Arithmetic with complex numbers is a bit tricky, but Python knows how to do it.
- The absolute value of a number x + y*1j is defined as the square root of the sum of the squares:
abs(x + y*1j) = sqrt(x**2 + y**2)which you may recognize as Pythagoras' Theorem for the hypotenuse of a right triangle. That's not accidental; the absolute value of x + y*1j is in fact the same as the distance from (0,0) (or 0+0j) to the point (x,y). And thus, abs(3+4j) is precisely 5!
Try it out! Just to get familiar with complex numbers, at the command-line Python prompt try
In [1]: c = 3 + 4j

In [2]: c
Out[2]: (3+4j)

In [3]: abs(c)
Out[3]: 5.0

In [4]: c**2
Out[4]: (-7+24j)
Python is happy to use the power operator (**) and other operators with complex numbers. However, note that you cannot compare complex numbers directly with > or < — they are 2D points, so there's no "greater than"! Thus, you cannot write
c > 2 for a complex
c (it will "throw" a TypeError)
You CAN compare the magnitude of complex numbers, however:
abs(c) > 2.
Note that the built-in abs function returns the magnitude of a complex number.
The inMSet function:
To determine whether or not a number c is in the Mandelbrot set, you will- Start with z0 = 0 + 0j and then
- repeatedly iterate zn+1 = zn2 + c
Truly determining whether or not this sequence goes off to infinity isn't feasible. To make a reasonable guess, we will have to decide on two things:
- The number of times we are willing to wait for the zn+1 = zn2 + c process to run
- A value that will represent "infinity"
Writing the inMSet function
You should copy your update function and change its name to inMSet. It's definitely better to copy and change that old function—do not call update directly. To get you started, here is the first line and a docstring for inMSet:
def inMSet(c, n):
    """inMSet accepts
            c for the update step of z = z**2+c
            n, the maximum number of times to run that step.
       Then, it returns
            False as soon as abs(z) gets larger than 2.
            True if abs(z) never gets larger than 2 (for n iterations).
    """
The inMSet function should return False if the
sequence zn+1 = zn2 + c ever yields a z value whose magnitude is greater than 2. It returns True otherwise.
Note that you will not need different variables for z0, z1, z2, and so on. Rather, you'll use a single variable z. You'll update the value of z within a loop, just as in update.
Also, note that the loop should return False as soon
as the value of z exceeds 2. If you try to wait until the
end of the loop, you may wind up with a complex number that is too
big for Python to represent!
Make sure that you are using return False somewhere inside your loop. You will want to return True after the loop has finished all of its iterations!
Check your inMSet function by copying and pasting these examples: ... either as assert tests:
assert inMSet(0 + 0j, 25) == True
assert inMSet(3 + 4j, 25) == False
assert inMSet(.3 + -.5j, 25) == True
assert inMSet(-.7 + .3j, 25) == False
assert inMSet(.42 + .2j, 25) == True
assert inMSet(.42 + .2j, 50) == False
With thanks to Francine W. (CS5 '20!) for these!
... or individually at the command line:
In [1]: c = 0 + 0j          # this one is in the set

In [2]: inMSet(c, 25)
Out[2]: True

In [3]: c = 3 + 4j          # this one is NOT in the set
# WARNING: this one might freeze or crash Python UNLESS your function
# returns False *as soon as* the magnitude is larger than 2.
# In other words, you need to return False _inside_ the loop
# (inside your if or your else, whichever is appropriate)!

In [4]: inMSet(c, 25)
False

In [5]: c = 0.3 + -0.5j     # this one is also in the set

In [6]: inMSet(c, 25)
Out[6]: True

In [7]: c = -0.7 + 0.3j     # this one is NOT in the set

In [8]: inMSet(c, 25)
Out[8]: False


In [9]: c = 0.42 + 0.2j

In [10]: inMSet(c, 25)      # this one _seems_ to be in the set
Out[10]: True

In [11]: inMSet(c, 50)      # but at 50 tries, it turns out that it's not!
Out[11]: False

In [12]: inMSet(0.42 + 0.2j, 50)
Out[12]: False              # another way to check a constant
Getting too many Trues?
If so, you might be checking for abs(z) > 2 after the for loop finishes. Be sure to check inside the loop! There is a subtle reason you need to check inside the loop: Many values get so large so fast that they overflow the capacity of Python's floating-point numbers. When they do, they cease to obey greater-than / less-than relationships, and so the test will fail. The solution is to check whether the magnitude of z ever gets bigger than 2 inside the for loop, in which case you should immediately return False. The return True, however, needs to stay outside the loop! As the last example illustrates, when numbers are close to the boundary of the Mandelbrot set, many additional iterations may be needed to determine whether they escape. This is why it is so computationally intensive to build high-resolution images of the Mandelbrot set.
Creating PNG images in Python
Getting started
Try out this code to get started:
from cs5png3 import *   # You might already have this line at the top...

def weWantThisPixel(col, row):
    """This function returns True if we want to show
       the pixel at col, row and False otherwise.
    """
    if col % 10 == 0  and  row % 10 == 0:
        return True
    else:
        return False

def test():
    """This function demonstrates how
       to create and save a PNG image.
    """
    width = 300
    height = 200
    image = PNGImage(width, height)

    # Create a loop that will draw some pixels.

    for col in range(width):
        for row in range(height):
            if weWantThisPixel(col, row):
                image.plotPoint(col, row)

    # We looped through every image pixel; we now write the file.

    image.saveFile()
Save this code, and then run it by typing test()—with
the parentheses—at the Python shell.
Windows users!
- If you get a DLL Error...
- ...if you're using Anaconda Python, you will need to run from the Anaconda Prompt terminal
- This page describes how.
- If you're not running an Anaconda Python, then something weird is happening: Ask us!
If everything goes well, test() will run through the nested loops and print a message that the file test.png has been created. That file should appear in the same directory as your hw8pr1.py file. Live-updating image viewers for each OS:
- On Mac, use Preview (likely your default)
- On newer Windows machines, it turns out that VSCode is your best bet!
- Drop the file test.png into the editing panel of your VSCode window (Note: you will get a different, dotted image!)

and then change the code and re-run it, go back to that tab, and it will have live-updated:

- Drop the file test.png into the editing panel of your VSCode window (Note: you will get a different, dotted image!)
- This works on Mac, too, but it's not the default for either system (unsurprisingly)
- Aside: png is short for portable network graphics.
Either way, for the above function, your image should be all white except for a regular, sparse point field, plotted wherever the row number and column number were both multiples of 10:
 By the way, you can zoom in and out of images with the menu options
or shortcuts. You might find that useful later when you're working
with the actual Mandelbrot set.
By the way, you can zoom in and out of images with the menu options
or shortcuts. You might find that useful later when you're working
with the actual Mandelbrot set.
Thought experiment: and vs. or in pixel plotting
Before changing the above code, write a short comment under the test function in your hw8pr1.py file describing how the image would change if you changed the lineif col % 10 == 0 and row % 10 == 0:to the line
if col % 10 == 0 or row % 10 == 0:Then, make that change from and to or and try it. On both Macs and PCs, the image does not have to be re-opened: if you leave the previous image window open, its image will update automatically. Just for practice, you might try creating other patterns in your image by changing the test and weWantThisPixel functions appropriately.
Some notes on how the test function works...
There are three lines of the test function that warrant a closer look:
- image = PNGImage(width, height) This line of code creates a variable of type PNGImage with
the specified height and width. The image variable holds the whole image! This is similar to the way a single
variable—often called L—can hold an arbitrarily
large list of items. When information is gathered together into a list
or an image or another structure, it is called a software object or just an object.
We will build objects of our own design in a couple of weeks; this lab is an opportunity to use them without worrying about how to create them from scratch. - image.plotPoint(col, row) An important property of software objects is that they carry around and call functions of their own! They do this using the dot . operator. Here, the image object is calling its own plotPoint function to place a pixel at the given column and row. Functions called in this way are sometimes called methods.
- image.saveFile() This line creates the new test.png file that holds the png image. It demonstrates another method (i.e., function) of the software object named image.
From pixel coordinates to complex coordinates
The problem Ultimately, we need to plot the Mandelbrot set within the complex plane. However, when we plot points in the image, we must manipulate pixels in their own coordinate system. As the testImage() example shows, pixel coordinates start at (0, 0) (in the lower left) and grow to (width-1, height-1) in the upper right. In the example above,width was 300
and height was 200, giving us a small-ish image that will render quickly.
The Mandelbrot Set, as the image below shows, lives in the box -2.0 ≤ x (or real coordinate) ≤ +1.0
and
-1.0 ≤ y (or imaginary coordinate) ≤ +1.0
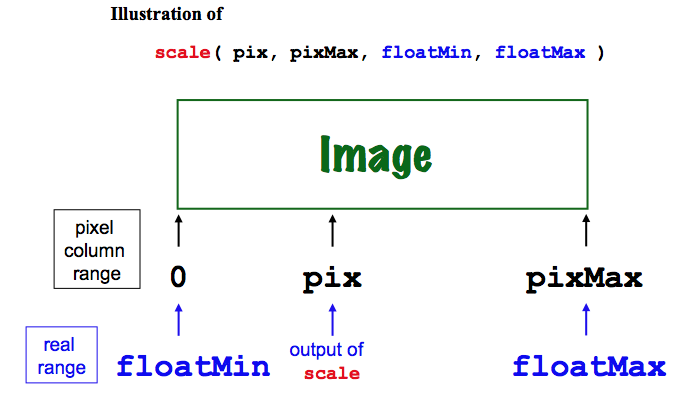
which is a 3.0 x 2.0 rectangle. So, we need to convert from each pixel's col integer value to a floating-point value, x. We also need to convert from each pixel's row integer value to the appropriate floating-point value, y. An image of these relationships:

The solution One function, named scale, will convert coordinates in general. So, you'll next write this scale function:
scale(pix, pixMax, floatMin, floatMax)that can be run as follows:
In [1]: scale(150, 200, -1.0, 1.0)
Out[1]: 0.5
Here, the arguments mean the following:
- The first argument, pix, is the current pixel value: we are at column 150 (or perhaps row 150;
scaledoesn't care). - The second argument, pixMax, is the maximum possible pixel value: pixels run from 0 to 200 in this case.
- The third argument, floatMin, is the minimum floating-point value. This is what the function will return when the first argument is 0.
- The fourth argument, floatMax, is the maximum floating-point value. This is what the function will return when the first argument is pixMax.
- How to use the quantity pix / pixMax
- How to use the quantity floatMax - floatMin
Writing the scale function
To compute this conversion back and forth from pixel coordinates to complex coordinates, write a function that starts as follows:
def scale(pix, pixMax, floatMin, floatMax):
    """scale accepts
           pix, the CURRENT pixel column (or row).
           pixMax, the total number of pixel columns.
           floatMin, the minimum floating-point value.
           floatMax, the maximum floating-point value.
       scale returns the floating-point value that
           corresponds to pix.
    """
The docstring describes the arguments: - pix, an integer representing a pixel column.
- pixMax, the total number of pixel columns available.
- floatMin, the floating-point lower endpoint of the image's axis.
- floatMax, the floating-point upper endpoint of the image's axis.
Once you have written your scale function, here are some test cases to try to be sure it is working:
In [1]: scale(100, 200, -2.0, 1.0)  # Halfway from -2 to 1 should be -0.5
Out[1]: -0.5

In [2]: scale(100, 200, -1.5, 1.5)  # Halfway from -1.5 to 1.5 should be 0.0
Out[2]: 0.0

In [3]: scale(100, 300, -2.0, 1.0)  # 1/3 of the way from -2 to 1 should be -1.0
Out[3]: -1.0

In [4]: scale(25, 300, -2.0, 1.0)   # 1/12 of the way from -2 to 1 should be -1.75
Out[4]: -1.75

In [5]: scale(299, 300, -2.0, 1.0)  # Your exact value may differ slightly...
Out[5]: 0.99
Note Although we initially described scale as computing x-coordinate (real-axis) floating-point values, your scale function works equally well for both the x- and the y-dimensions. You don't need a separate function for the vertical axis!
Visualizing the Mandelbrot set in black and white: mset
This part asks you to put the pieces from the above sections together into a function named mset() that computes the set of points in the Mandelbrot set on the complex plane and creates a bitmap of them, of size width by height. x and y ranges To focus on the interesting part of the complex plane, we will limit the ranges of x and y to-2.0 ≤ x or real coordinate ≤ +1.0
and
-1.0 ≤ y or imaginary coordinate ≤ +1.0
which is a 3.0 x 2.0 rectangle.
Reprise of picture:
How to get started? Start by copying the code from the test function and renaming it as mset:
def mset():
    """Creates a 300x200 image of the Mandelbrot set.
    """
    width = 300*1       # We can update the 1 later to enlarge the image...
    height = 200*1
    image = PNGImage(width, height)

    # Create a loop to draw some pixels

    for col in range(width):
        for row in range(height):
            # Use scale twice:
            #   once to create the real part of c (x)
            # x = scale( ..., ..., ..., ...)
            #   once to create the imaginary part of c (y)
            # y = scale( ..., ..., ..., ...)
            # THEN, create c, choose n, and test:
            c = x + y*1j
            n = 25
            if inMSet(c, n) == True:
                image.plotPoint(col, row)

    # We looped through every image pixel; we now write the file
    image.saveFile()
(Note: in the above code we wrote "if inMSet(c, n) == True:"
to make it clear what we're doing. Experienced programmers would
usually write just "if inMSet(c, n):", which accomplishes the
same thing. Why does this work? And why is it preferred style?)
To build the Mandelbrot set, you will need to change a number of
behaviors in this function—start where the comment suggests that
you should Use scale twice:
- For each pixel col, you need to compute the real (x) coordinate of that pixel in the complex plane. Use the variable x to hold this x-coordinate, and use the scale function to find it!
- For each pixel row, you need to compute the imaginary (y) coordinate of that pixel in the complex plane. Use the variable y to hold this y-coordinate, and again use the scale function to find it! Even though this will be the imaginary part of a complex number, it is simply a normal floating-point value.
- Using the real and imaginary parts computed in the prior two steps, create a variable named c that holds a complex value with those real (x) and imaginary (y) parts, respectively. Recall that you'll need to multiply y*1j, not y*j!
- Finally, your test for which pixel col and row values to plot will involve inMSet, the first function you wrote. You'll want to specify a value for the argument named n to that inMSet function. We suggest that you start with a value of 25 for n.
In [1]: mset()and check to be sure that the image you get is a black-and-white version of the Mandelbrot set, e.g., something like this:
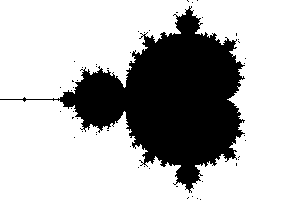 Distorted? Rotated? Check to be sure you haven't mixed up
 x
and y!
Adding features to your mset function
Changing colors...
You don't have to use just black and white! The image.plotPoint method accepts an optional third argument that represents the color of the point you'd like to plot. Here is an example:image.plotPoint(col, row, (0, 0, 255))The third argument here is a list that uses parentheses instead of square brackets. Parenthesized lists are called tuples in Python. Tuples are faster to access than lists, but their elements cannot be assigned to, so they're often used for constants such as colors. The three elements of the color tuple above are red, then green, then blue; each of those three color components must be an integer from 0 to 255. Thus, the tuple above, (0, 0, 255) is pure blue. To change the background of the set, add the lines
else:
    image.plotPoint(col,row, (0, 0, 0))
within the loops that run over each col and each row. This will explicitly plot, in black, all of the points not in the Mandelbrot Set
Try it out! perhaps first by changing your Mandelbrot set to orange (255, 175, 0) on top of a black background (0, 0, 0).
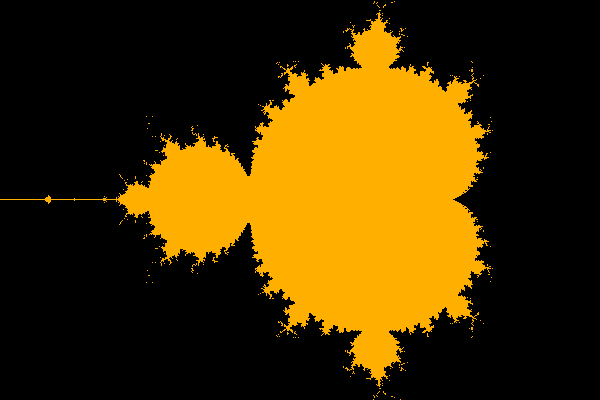 Then, change the colors to something more to your liking!
Feel free to enlarge your image, too—it will take longer to render, but you'll be able to resolve more detail in the result!
Then, change the colors to something more to your liking!
Feel free to enlarge your image, too—it will take longer to render, but you'll be able to resolve more detail in the result!
Too slow? Note that inside the "inner" loop,
col never
changes. But you're calling scale to calculate x every time. How
could you change the code so that you calculate x only when col
changes? (Hint: No extra code is needed.)
No magic numbers!
Magic Numbers are simply literal numeric values that you have typed into your code. They're called magic numbers because if someone tries to read your code, the values and purpose of those numbers seem to have been "pulled out of a hat." To keep your code as flexible and expandable as possible, it's a good idea to avoid using these "magic numbers" for important quantities in various places in your functions. Instead, it's better to collect all of those magic numbers at the very top of your functions (after the docstring) and to give them useful names that suggest their purpose. It's common, though not required, to use only capital letters for these values. In addition to being clearer, this makes it much easier to add or change functionality in your code—all of the important quantities are defined one time and in one place. For this part of the lab, move all of your magic numbers to the top of the function and give them descriptive names. For example, these five lines are a good starting point:NUM_ITERATIONS = 25 # Number of updates; will be assigned to n XMIN = -2.0 # The smallest real coordinate value XMAX = 1.0 # The largest real coordinate value YMIN = -1.0 # The smallest imaginary coordinate value YMAX = 1.0 # The largest imaginary coordinate valueThese variables can then be changed in one place if you want to alter the "window" onto the Mandelbrot set being plotted. In the next part, you'll change these values to zoom into the Mandelbrot set.
Zooming in!
For this part, simply run your mset function with some different values of XMAX, XMIN, YMAX, and YMIN to create images of different parts of the Mandelbrot Set. Here is an example that uses
    NUM_ITERATIONS = 100  # of updates
    XMIN = -1.2  # The smallest real coordinate value
    XMAX =  -.6  # The largest real coordinate value
    YMIN = -.5   # The smallest imaginary coordinate value
    YMAX = -.01  # The largest imaginary coordinate value
    FACTOR = 3
    width = 300*FACTOR
    height = 200*FACTOR
    image = PNGImage(width, height)   # make sure the image is the correct size!
 with acknowledgments and thanks to Michelle Lum, in
CS5 in '19, whose code was used here!
Just for the record, the above image used these values:
with acknowledgments and thanks to Michelle Lum, in
CS5 in '19, whose code was used here!
Just for the record, the above image used these values:
    NUM_ITERATIONS = 100  # of updates
    XMIN = -1.2  # The smallest real coordinate value
    XMAX =  -.6  # The largest real coordinate value
    YMIN = -.5   # The smallest imaginary coordinate value
    YMAX = -.01  # The largest imaginary coordinate value
    FACTOR = 3
    width = 300*FACTOR
    height = 200*FACTOR
    image = PNGImage(width, height)  # make sure the image is the right size
Another range you're welcome to try is amidst the "infinite snowmen":
    NUMITER = 25
    XMIN = -1.2
    XMAX = -.6
    YMIN = -.5
    YMAX = -.1
Optionally, feel free to look around to find another set of values that shows an interesting
piece of the set—and note what they are in a comment in your
hw8pr1.py file. As a guide, you might consider the
suggestions at
this page on the "Seahorse Valley".
Note that the aspect ratio of the image is 3:2 (horizontal:vertical), and if you keep this aspect ratio in your ranges, the set will be scaled naturally.
It will work with different ratios, but to maintain the natural scaling, you would have to change the height and width of the image accordingly. Or you could compute the height and width, but that's not required for this lab.
Sounds
The Mandelbrot set is infinitely interesting…and in fact you can do more than just make pictures with it. Feel free to explore on the Internets!Complete!
You've completed Lab #8 and built your own Mandelbrot Set! Be sure to submit your hw8pr1.py to the usual spot on this week's homework... Also welcome are any and all screenshots you're willing to share!There are more directions to go, for sure, but they're 100% optional. If you'd like to visualize the different escape velocities or change the resolution or perhaps mandelbrotify another image, these next sections describe how to add features to your Mandelbrot-set program. They're optional, but fun!
Completely Optional: Visualizing escape velocities
These extensions are optional (but fun!)—this first one lets you see the relative speeds with which the points in and around the Mandelbrot set escape to infinity.Images of fractals often use color to represent how fast points are diverging toward infinity when they are not contained in the fractal itself. For this problem, create a new version of
mset called msetColor . Simply
copy and paste your old code, because its basic behavior will be the
same. However, you should alter the
msetColor function so that it plots points that escape to infinity more quickly in different colors.
The idea is to have your
msetColor function plot the Mandelbrot set as before. In addition, however, use at least three different
colors to show how quickly points outside the set are
diverging—this is their "escape velocity." Making this change
will require a change to
your inMSet helper function, as well. We suggest that you
copy, paste, and rename inMSet so that you
can change the new version without affecting the old one.
There are several ways to measure the "escape velocity" of a particular point. One is to look at the resulting magnitude after the
iterative updates. Another is to count the number of iterations required before it "escapes" to a magnitude that is greater then 2.
An advantage of the latter approach is that there are fewer different escape velocities to deal with.
Choose one of those approaches—or design
another of your own—to implement msetColor.
Two examples—entirely grayscale, admittedly!
 )
) 

Mandelbrotifying another image
The png library can read images, too. (As a warning, it's not overly fast in converting them to Python lists…) The result is that you can use another image's pixels to determine the look of the points in (or out of) your Mandelbrot set, e.g., Here is an example function to show how to read in an image (the alien.png image from the pngs folder:
def example():
    """Shows how to access the pixels of another png image.

       inputPixels will be a list of rows,
           each of which is a list of columns,
           each of which is a list [r,g,b].
    """

    iP = getRGB("./pngs/alien.png")
    inputPixels = []
    for row in iP[::-1]:             # The rows are reversed
        # convert to our format (not worth worrying about)
        inputPixels += [[ px[0][:-1] for px in row ]]

    height = len(inputPixels)
    width = len(inputPixels[0])
    image = PNGImage(width, height)

    for col in range(width):
        for row in range(height):
            if col%10 < 5 and row%10 < 5: # Only plot some of the pixels
                image.plotPoint(col, row, inputPixels[row][col])

    image.saveFile()
The above code produces the following image:
 Try Mandebrotifying this image—or another png you'd like to use…
When you are done—and it can be surprisingly addictive—you are done with lab! Be sure to submit your
hw8pr1.py file ...