In this project, you will engage (at a low level) with a range of synchronization problems. Part A of the project (this part!) deals with conflicting read-modify-write operations on single variables and complex data structures (an ordered linked list). It is broken up into multiple steps:
The basic shared counter problem was introduced in section 28.1.
Mutexes, test-and-set, spin-locks, and compare-and-swap were described in (many sections of) chapter 28.
Synchronization of partitioned lists was introduced in section 29.2.
A single tarball (.tar.gz) containing:
You are free to implement methods beyond those described in the provided SortedList.h, but you cannot make any changes to that header file. This header file describes the interfaces that you are required to implement.
   lab2_add.csv: Makefile lab2_add
       rm -f $@
       ./lab2_add --threads=1  --iterations=100    >> lab2_add.csv
       ./lab2_add --threads=1  --iterations=1000   >> lab2_add.csv
	...
Some of these tests (particularly spin-locks with large numbers of threads) will consume a great many cycles. Most desktop systems can probably complete all of these tests in one or two minutes, but a weaker system might require the better part of an hour for a single set of runs.
To perform this assignment, you may need to study a few things:
We are providing you with sample (gnuplot) data reduction scripts for the first parts of this assignment:
These scripts take no arguments, read .csv files with hard-coded names (lab2_add.csv, lab2_list.csv) and produce graphical output (.png files) that correspond to your deliverable graphs. These scripts use grep(1) to extract the desired data points from your lab2_add.csv and lab2_list.csv files. They will report errors if any of the required data points are missing (e.g. because you have not yet run those tests or they produced no data).
If no range is specified for an axis gnuplot will automatically set it to include the maximum and minimum values. The problem with this is that a point on an axis or at the top of the graph, it may be difficult to see. If you find this happening, you use the xrange and yrange directives to set the the minimum and maximum values for either axis to be beyond your minimum and maximum values.
If gnuplot is not installed in its standard location (/usr/bin) you will need to change the first line of each of these scripts to reflect the location where gnuplot is installed on the system on which you are running.
In the next and final part of this assignment, you can use these as a basis for creating your own graphing scripts.
Start with a basic add routine:
        void add(long long *pointer, long long value) {
                long long sum = *pointer + value;
                *pointer = sum;
        }
Write a test driver program (called lab2_add) that:
The supported command line options and expected output are illustrated below:
	% ./lab2_add --iterations=10000 --threads=10
	add-none,10,10000,200000,6574000,32,374
	%
This project calls for you to produce and graph a great deal of data. If you install gnuplot(1) and append all of your test output to a single file (lab2_add.csv in part 1, lab2_list.csv in part 2), you can use our sample data reduction scripts (lab2_add.gp and lab2_list.gp) to produce all of the required data plots.
Note that each of these scripts produce all of the required graphs. Early in the process, you will not have yet generated all of the data required for all of the graphs, and gnuplot will report errors because (for some of the graphs) it found no data to plot.
Run your program for ranges of iterations (100, 1000, 10000, 100000) values, capture the output, and note how many threads and iterations it takes to (fairly consistently) result in a failure (non-zero sum). Review the results and (in your README file) answer the following question:
There are ways to cause a thread to immediately yield
(rather than waiting for a time slice end to preempt it).
Posix includes a sched_yield operation.
Extend the basic add routine to more easily cause the failures:
	int opt_yield;
        void add(long long *pointer, long long value) {
                long long sum = *pointer + value;
                if (opt_yield)
                        sched_yield();
                *pointer = sum;
        }
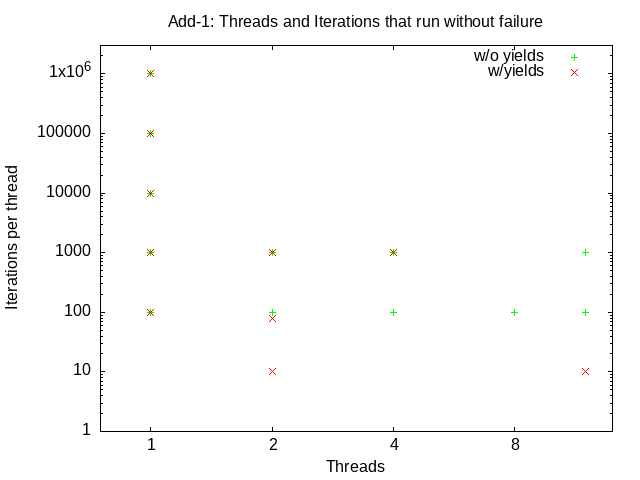
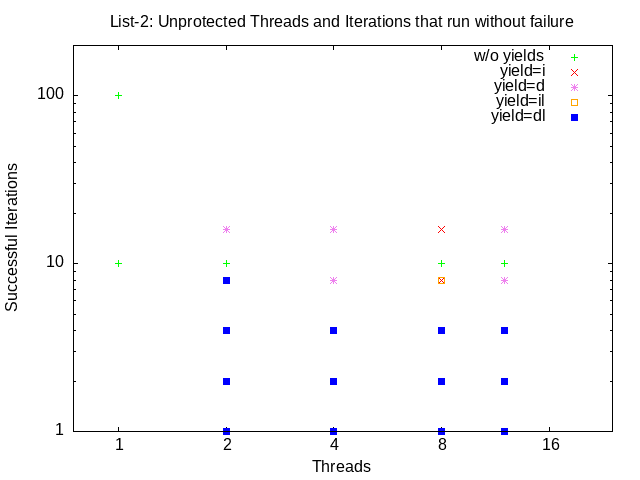
Add a new --yield to your driver program that sets opt_yield to 1. If ths hoption has been specified, each line of statistics output should begin with add-yield, and tests without synchronization should be tagged add-yield-none. Re-run your tests, with yields, for ranges of threads (2,4,8,12) and iterations (10, 20, 40, 80, 100, 1000, 10000, 100000), capture the output, and plot (using the supplied data reduction script) the (existence of) successful runs vs the number of threads and iterations. Submit this plot as lab2_add-1.png. Note how many iterations and threads it takes to (fairly consistently) result in a failure with the yield option. It should now be much easier to cause the failures.
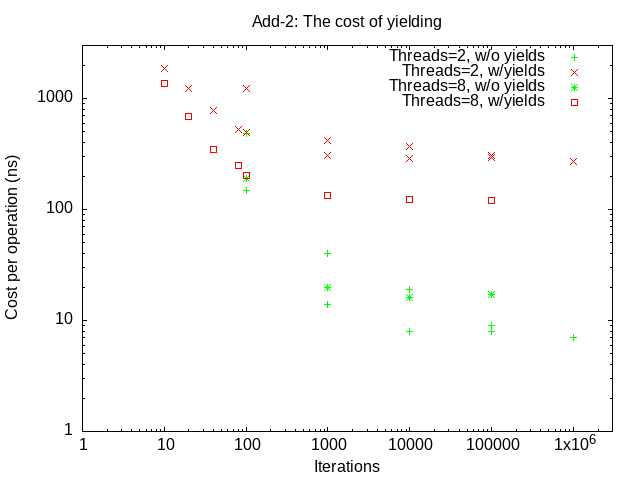
Compare the average execution time of the yield and non-yield versions a range threads (2, 8) and of iterations (100, 1000, 10000, 100000). Capture the results and plot (using the supplied data reduction script) the time per operation vs the number of iterations, for yield and non-yield executions. Submit this plot as lab2_add-2.png. You should note that the --yield runs are much slower than the non-yield runs. Review the results and (in your README file) answer the following questions:
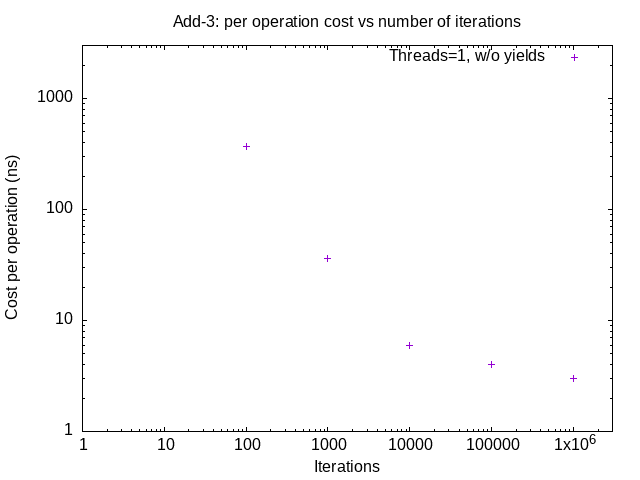
Plot (using the supplied data reduction script), for a single thread, the average cost per operation (non-yield) as a function of the number of iterations. Submit this plot as lab2_add-3.png. You should note that the average cost per operation goes down as the number of iterations goes up. Review the results and (in your README file) answer the following questions:
Implement three new versions of your add function:
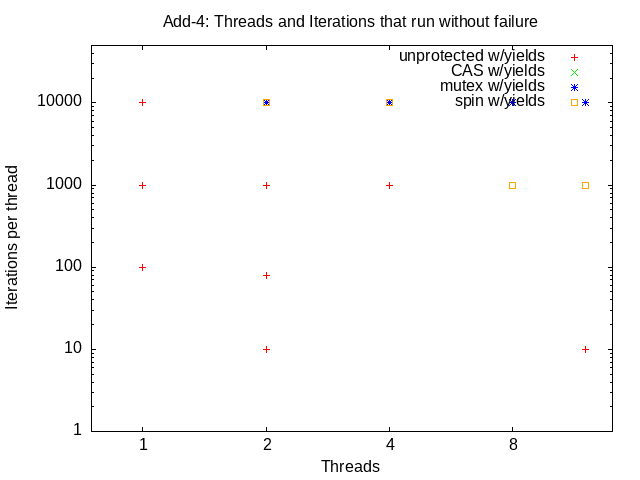
Use your --yield options to confirm that, even for large numbers of threads (2, 4, 8, 12) and iterations (10,000 for mutexes and CAS, only 1,000 for spin locks) that reliably failed in the unprotected scenarios, all three of these serialization mechanisms eliminate the race conditions in the add critical section. [Note that we suggest a smaller number of threads/iterations when you test spin-lock synchronization]
Capture the output output, and plot (using the supplied data reduction script) the (existence of) successful runs vs the number of threads and iterations for each synchronization option (none, mutex, spin, compare-and-swap). Submit this plot as lab2_add-4.png.
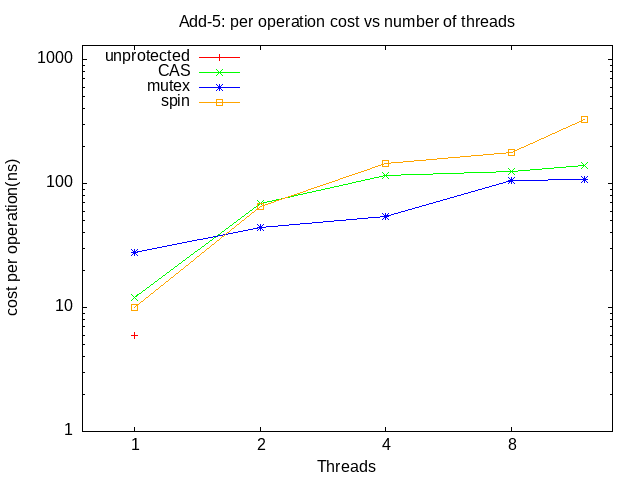
Using a large enough number of iterations (e.g. 10,000) to overcome the issues raised in the question 2.1.3, test all four (no yield) versions (unprotected, mutex, spin-lock, compare-and-swap) for a range of number of threads (1,2,4,8,12), capture the output, and plot (using the supplied data reduction script) the average time per operation (non-yield), vs the number of threads. Submit this plot as lab2_add-5.png. Review the results and (in your README file) answer the following questions:
No two sets of graphs will be identical because different machines have different speeds, numbers of cores, and background loads. As such I do not expect your graphs, costs or failure rates to agree with mine. But, as a sanity check, I do expect all solutions to show similarly shaped curves. To set your expectations on what kinds of output you might expect, these are my graphs:
Review the interface specifications for a sorted doubly linked list package described in the header file SortedList.h, and implement all four methods in a new module named SortedList.c. Note that the interface includes three software-conterolled yield options. Identify the critical section in each of your four methods and add calls to pthread_yield or sched_yield, controlled by the yield options:
In each of these routines there are multiple places where a preemption could result in such a problem. Where should you put the yield? Pick any spot in the routine where you think a conflicting operation would be particularly bad. We are not asking you to mark all such places, but merely to add a yield in one such place, so that we can cause those conflicts to happen more often.
Write a test driver program called lab2_list that:
In part one, a synchronization error merely resulted in the subtracts and adds not balancing out. In this part, a synchronization error is likely to result in a corrupted list. If, at any time, you find evidence of a corrupted list (e.g. you cannot find a key that you know you inserted, or the list length is not zero at the end of the test), you should log an error message (to stderr) and exit immediately without producing the above results record. Note that in some cases your program may not detect an error, but may simply experience a segmentation fault. Catch these, and log and return an error. When you look at your test results, you should consider any test that did not produce output to have failed.
The supported command line options and expected output are illustrated below:
	% ./lab2-list --threads=10 --iterations=1000 --yield=id
	list-id-none,10,1000,1,30000,527103247,25355
	%
Before you try running parallel list operations you will want to confirm that they work single-threaded. If there are any bugs to be found, they will likely be in the middle of long lists. To help debug such problems you may want to create a listdump method that you can call to print out the entire list prior to each operation. Then, when it fails, you can see what the list that caused the failure looked like.
	/*
	 * (diagnostic function to) dump out a list
	 *
	 * @param       pointer to list head
	 * @param       message to go in front of dump
	 */
	void listdump(SortedListElement_t *list, char *title) {
		SortedListElement_t *e = list;
		fprintf(stderr,"%s:\n", title);
		do {
			fprintf(stderr, "\t%s at %p, key=%s, next=%p, prev=%p\n",
				(e == list) ? "head" : "elem", e,
				(e->key == 0) ? "null" : e->key,
				e->next, e->prev);
			e = e->next;

		} while( e != NULL && e != list );
		fprintf(stderr, "\t%s\n", (e == NULL) ? "list ends" : "back to head");
	}
Such logs can be huge (e.g. tens of thousands of lines), but you only enable them when you need to debug a problem, and (based on when the failure occurred) you know where in the log to start looking. When infrequent bugs in complex software are difficult to catch in a debugger, it is often easier to find the precipitating conditions in a log. And once you know what the initial conditions were, it is usually not too difficult to figure out how your code would have (mis-)handled it.
Most of your Makefile rules thus far have been to compile a program from a
single module. You will need at least two modules to build this program.
The rule for such a build should tell make that multiple object modules are
required, and how to combine them. For example:
	lab2_list: lab2_list.o SortedList.o
		gcc -o $@ -pthread lab2_list.o SortedList.o
The make program will automatically know how to build those
object modules from your C source modules, and will automatically use
the CFLAGS that you have defined (with their extra warnings).
Note that the lab2_list program is expected to fail when running multiple threads without synchronization. Make sure that your Makefile continues executing despite such failures (e.g. put a '-' in front of commands that are expected to fail).
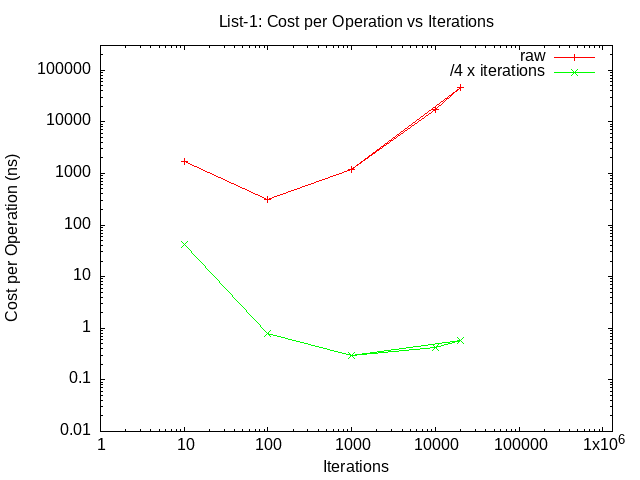
Run your program with a single thread, and increasing numbers of iterations (10, 100, 1000, 10000, 20000), capture the output, and plot (using the supplied data reduction script) the mean cost per operation vs the number of iterations. Submit this plot as lab2_list-1.png. These results should be quite different from what you observed when testing your add function with increasing numbers of iterations.
The time per iteration may initially go down with the number of iterations (as it did in part 1), but it eventually becomes linear with the number of iterations! This is because the time to insert into or search a sorted list is proportional to the list length. This is to be expected ... but we are primarily interested in the cost of serialization, and so we would like to separate the per operation costs from the per-element costs. The easiest way to do this is to divide the cost per iteration (total / (threads * iterations)) by the average search distance (iterations/4). Why iterations/4?
The sanity check script will examine your reported times per iteration, and report an error of they are implausibly long or short. If you are testing on a departmental server, there will almost surely be other students using it at the same time. This may result in wide variations in execution speed, which could
Run your program and see how many parallel threads (2,4,8,12) and iterations (1, 10,100,1000) it takes to fairly consistently demonstrate a problem. Then run it again using various combinations of yield options and see how many threads (2,4,8,12) and iterations (1, 2,4,8,16,32) it takes to fairly consistently demonstrate the problem. Make sure that you can demonstrate:
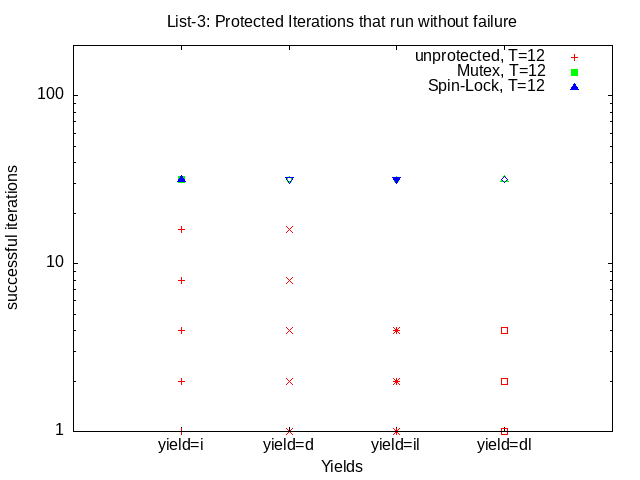
Add two new options to your program to call two new versions of these methods: one set of operations protected by pthread_mutexes (--sync=m), and another protected by test-and-set spin locks (--sync=s). Using your --yield options, demonstrate that either of these protections seems to eliminate all of the problems, even for moderate numbers of threads (12) and iterations (32). [Note we limit the number of iterations because of how very slow the spin-lock version becomes with larger numbers of threads and iterations ... which we will get to next].
Capture the output, and plot (using the supplied data reduction script) the (existence of) successful runs vs the number of iterations for mutex and spin-lock protection with each of the above four yield combinations. Submit this plot as lab2_list-3.png.
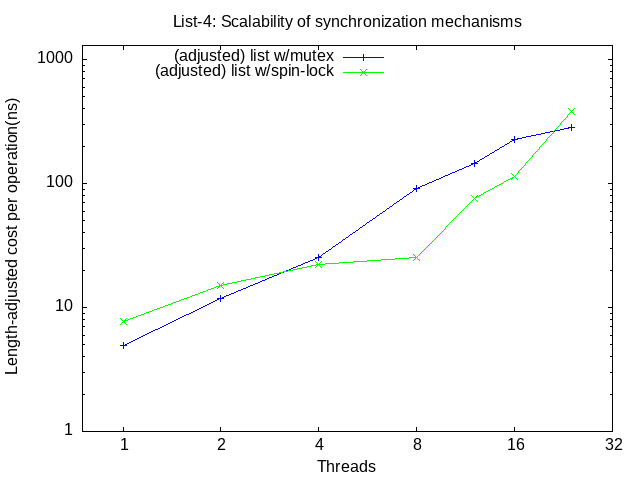
Choose an appropriate number of iterations (e.g. 1000) to overcome start-up costs and rerun your program without the yields for a range of # threads (1, 2, 4, 8, 12, 16, 24). Capture the output, and plot (using the supplied data reduction script) the (corrected for list length) per operation times (for each of the synchronization options: mutex, spin) vs the number of threads. Submit this plot as lab2_list-4.png. Review the results, compare them with the analogous add timings (add-5.png) and (in your README file) answer the following questions:
QUESTION 2.2.2 - scalability of spin locks
To set your expectations on what kinds of output you might expect, these are my graphs:
Your README file must include lines of the form:
Your tarball should have a name of the form lab2a-studentID.tar.gz.
You can sanity check your submission with this
test script.
Projects that do not pass the test script will not be accepted!
We will test it on a departmental Linux server. You would be well advised to test your submission on that platform before submitting it.
Points for this project will be awarded:
| value | feature |
|---|---|
| Packaging and build (10% total) | |
| 2% | un-tars expected contents |
| 3% | clean build of correct programs w/default action (no warnings) |
| 3% | Makefile has working clean, dist, test and graphs targets |
| 2% | reasonableness of README contents |
| Analysis (20% total) | |
| 4% | General clarity of thought and understanding |
| 2% | (each) 2.1.1-2.1.4 |
| 4% | (each) 2.2.1-2 |
| Code Review (20%) | |
| 4% | overall readability and reasonableness |
| 2% | add: yields correct and in appropriate places |
| 4% | list: yields correct and in appropriate places |
| 2% | mutex correctly used for add |
| 2% | mutex correctly used for list |
| 2% | spin-lock correctly implemented and used for add |
| 2% | spin-lock correctly implemented and used for list |
| 2% | compare-and-swap correctly implemented and used for add |
| Add results (20% total) | |
| 2% | add: threads and iterations |
| 2% | add: correct output format |
| 2% | add: reasonable time reporting |
| 1% | add: correct yield |
| 3% | add: correct mutex |
| 3% | add: correct spin |
| 3% | add: correct CAS |
| 4% | add: graphs (showed expected results) |
| List results (30% total) | |
| 2% | list: threads and iterations |
| 2% | list: correct output format |
| 2% | list: reasonable time reporting |
| 6% | list: correct yield |
| 6% | list: correct mutex |
| 6% | list: correct spin |
| 6% | list: graphs (showed expected results) |
Note: if your program does not accept the correct options or produce the correct output, you are likely to receive a zero for the results portion of your grade. Look carefully at the sample commands and output. If you have questions, ask.