|
|
For this assignment, submit a zipped folder named hw1.zip
that contains four files that contain the entire interactive
console session for each of these activities. The file names should be
pr1.txt,
pr2.txt,
pr3.txt, and
pr4.txt.
- For pr1.txt, work through the examples
in the "First R example session" by UC Davis's Norm Matloff, which is
available from this
link, starting on page 7.
- For problem 2, work through the examples
in the "Tutorial for the R Statistical Package" by UC Denver's Stephanie
Santorico and Mark Shin, whose text, datasets, and example script
are available from this link.
The thirty-page tutorial may seem like a lot, but it flows very quickly -- and
has a wonderful overview of R's capabilities and some of its technical details.
For each of the five sections/chapters in that tutorial,
submit a separate file with the contents of
your console interactions:
- pr2_1.txt
- pr2_2.txt
- pr2_3.txt
- pr2_4.txt
- pr2_5.txt
By working through this tutorial, your hw1 folder will end up containing
several data files -- this is OK -- please submit those, too.
- For pr3.txt, download this
hw1_data.zip file, unzip it, and read the dataset into
R using the commands you encountered in problem 2, above. Then, at the
interactive console prompt, compose commands that solve the
challenges in this quiz. Of course, you may try as many times as you
like to get the solutions, but after you come up with each solution, include
a comment at the prompt similar to this:
# above is the solution to Q. 1
-
For pr4.txt, read through the first five chapters of the Data Science Text by
Syracuse's Jeffrey Stanton. As you do, complete the examples that the chapters
explain (in fact, only chapters 3 and 5 have examples). This is about 39 pages, but
it is smooth reading with a solid foundation of what is meant by "Data
Science".
Finally, create
a data frame in the style of Chapter 5's "family members" example, but
using the data from three columns -- class (name/characters), states (number), and food (also characters) --
from all of the students in IST 380 that we collected on the
first day. That data is now posted here (click for a larger view) 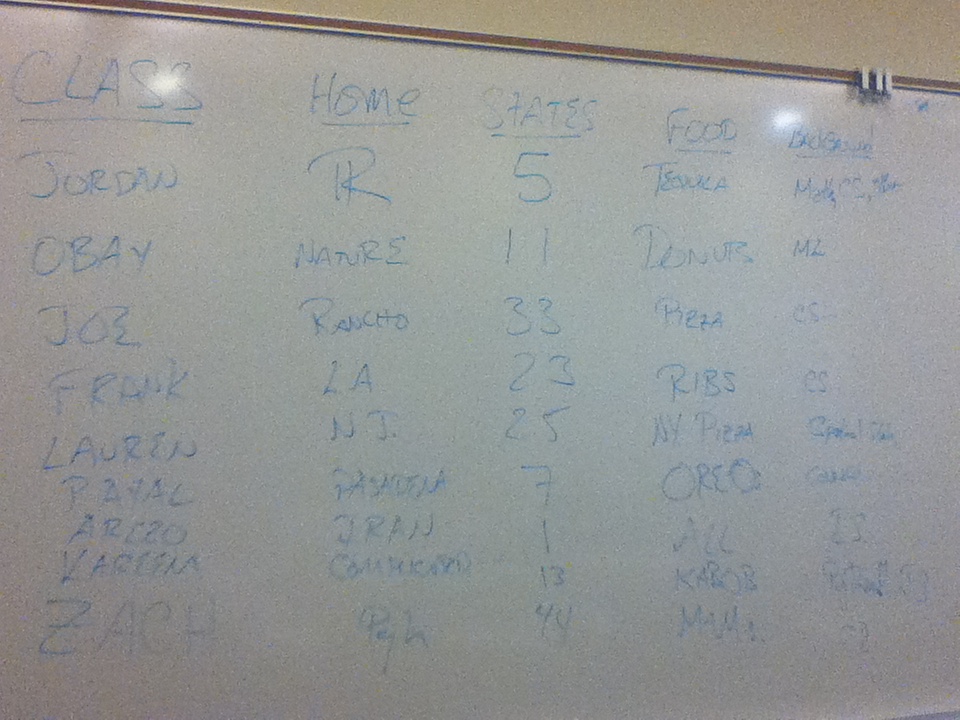 , but
in image form -- so you'll need to create the dataset yourself.
You're welcome to do it in R by hand, but you're equally welcome to input it
into Excel, save it as a .csv file, and then read it into R!
Finally, use summary to print a statistical summary of all of that data, too.
Submit your console interactions as pr4.txt. , but
in image form -- so you'll need to create the dataset yourself.
You're welcome to do it in R by hand, but you're equally welcome to input it
into Excel, save it as a .csv file, and then read it into R!
Finally, use summary to print a statistical summary of all of that data, too.
Submit your console interactions as pr4.txt.
|