Ken Dye
Mapping with only a bumper
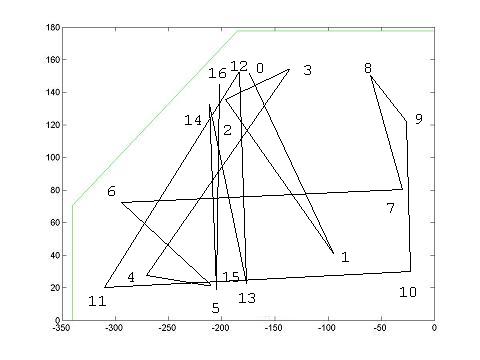
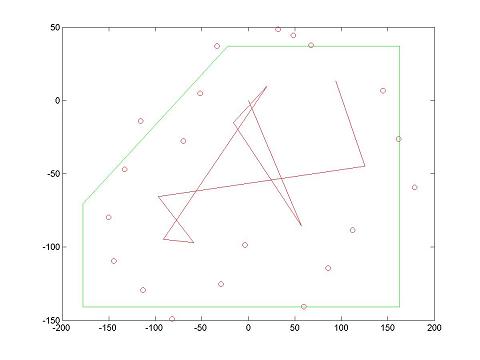
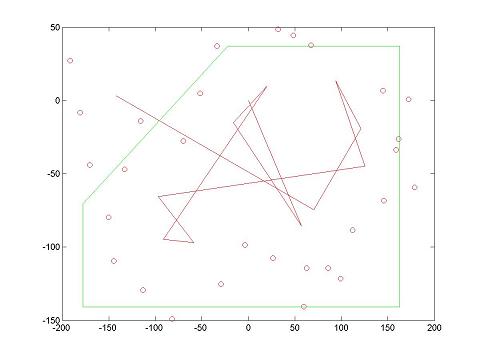
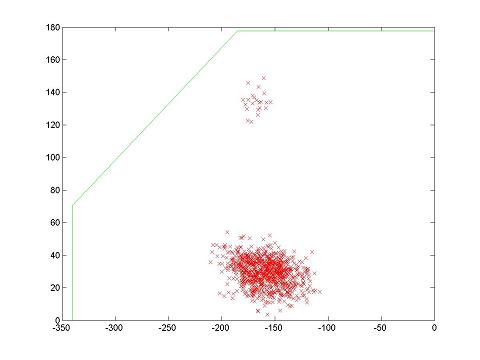
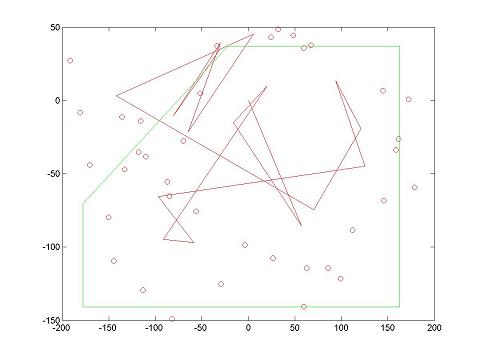
Here is a step through of the localization algorithm on a sample run, pictured above. The above picture was created by me drawing the path of the cart as I took data. In the pictures below, the left is the location particles generated by the localizing program, and the right is the raw data plotted as a series of vectors, end to end. The circles in the righthand plots are points on the bumper in sets of 3, one each at the left, right, and middle.
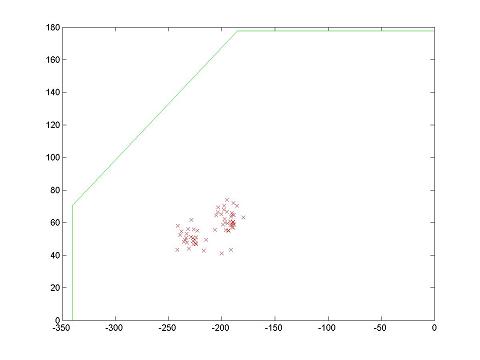
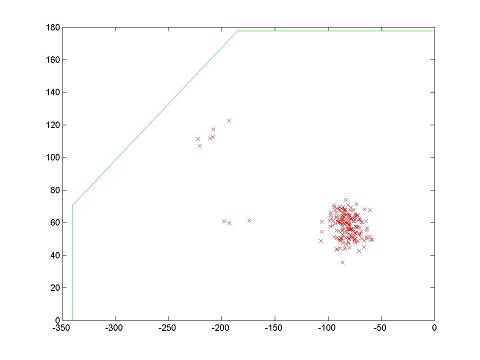
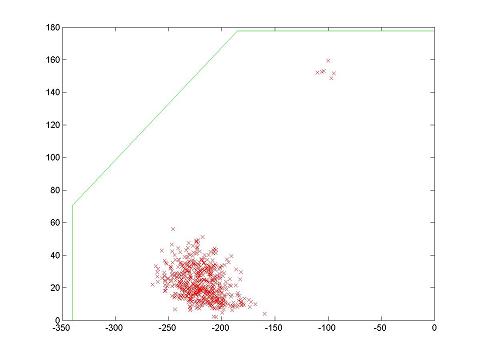
Pictured above are the results after five hits, when the location particles had more or less coalesced. As you can see on the right, this is pretty close to the right location, and is in fact probably a better guess. The bumper circles in the righthand plot are outside the green map outline, meaning the location isn't quite right.
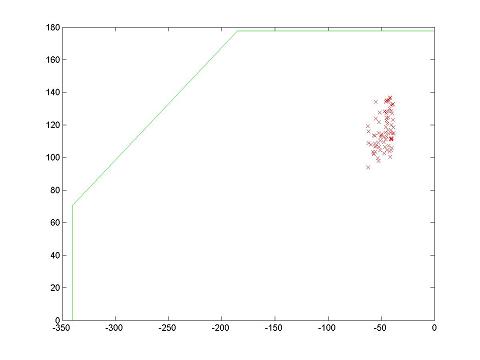
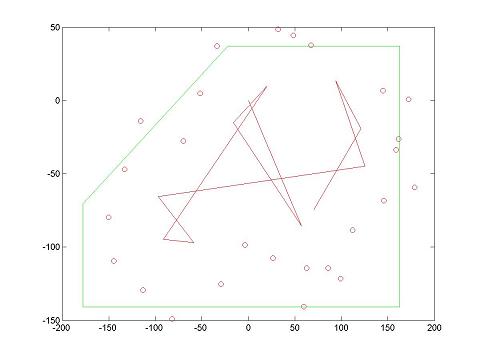
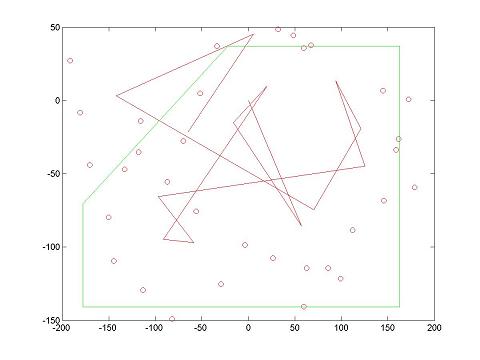
Here are the results after eight hits. The actual location of the hit was in the upper right corner with the cart facing north. The density of the cluster in the left plot is highest at the top, and this is pretty close to where the center of the cart was when its bumper hit the north wall. You can see from the right plot that the raw readings are starting to give a pretty skewed location. Taking this data I saw there was a fair amount of wheel slippage at hit 6 because the bumper hit the wall at an angle only slightly off of 90 degrees and flattened against it, destroying that small angle.
This is one of the challenges that the localization algorithm has to deal with. The errors between bumps tend to be either very small or very large, so it is difficult to find a way of distrubuting the particles that will work for both situations. The next few pictures illustrate how it attempts to handle this.
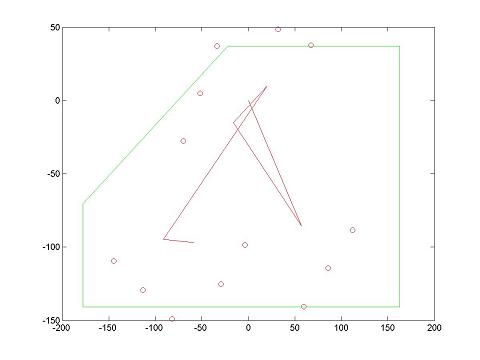
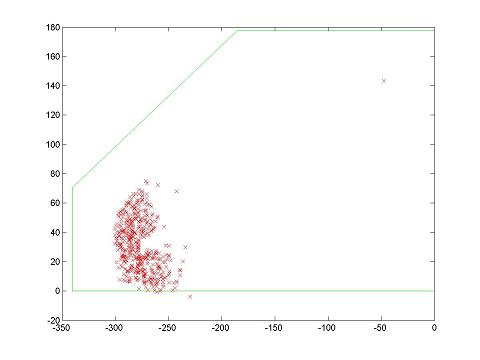
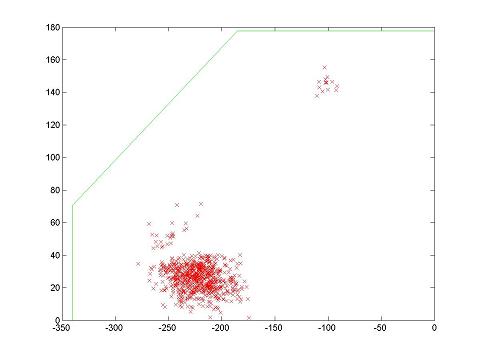
Pictured here are the results after 10 hits. The localizer does very well. The tenth hit did in fact happen with the cart in the southeast corner facing southeast. The two smaller clusters arrose after just two complete iterations from the relative tight cluster at hit 8 because of the large uncertainties that have to be given in the movement of the particles. This map, a rectangle with a corner cut off, looks pretty close to symmetric within the error spread used to move the particles, so clusters like this start small and have the potential to grow very large. When this happens it usually takes 3 or 4 more iterations for the location to reconverge.
The next move, hit 11, pictured above, was a long move across the map. These moves contain the most information since they have the most potential to move wayward particles off the map (and so eliminate them). This move almost completely destroyed the clusters we were worried about in the previous iteration, but not completely. One particle survived. It will grow, since the the northeast and southwest corners look very similar to my necessarily high smear model.
Here is hit 13. The main clump is in the correct location, but the lone particle has grown alarmingly. The algorithm I use weights all particles evenly, since there isn't a terribly good weight to weight them. The certainty is in the clustering and number of points.

Here is hit 15. The main clump is still in the correct location, but the rogue clump is denser still.
Here is hit 16, and it finally fails. The actual location should be where the small clump is. The last 5 moves or so were relatively small and this magnified the problems associated with having two clumps in almost symmetric locations. I believe if I continued the run with more hits, it would once again localize to the right spot. The accuracy tends to be cyclic, since good localizing only tends to happen after large moves that most completely differentiate one spot from another.
Obviously this needs further work. I'm going to look into figuring out a way to weight the particles, perhaps by how close they are the edge of the map (since the range of orientations that put the cart's center close to the wall is small.)