I set out to work on this project by searching articles for methods on automated gene annotation systems with neural networks. I came across two types of annotation systems, one that used similarity in gene sequence and others that were based on other gene relationships such as protein-protein interactions. The ones that used similarity of gene sequence relied on the fact that the function of the similar proteins would be somewhat similar to the original gene, which turned out to be a fairly good assumtion. The other system used protein-protein interactions relied on the same assumption of knowing the function of the other interacting proteins, but there is much less data for the protein-protein interactions. I will start with the gene sequence similarity model, and hopefully incorporate interactions if I am able.
While preparing for my paper presentation in class I came across a paper that really helped outline what a automated annotation system using sequence similarity would look like. I was confused what the inputs to a system would be. At first I thought that the inputs to the system would be part of the gene sequence, but gene sequence is very variable, and it would be really hard to infer similarity from that alone. So the paper set out a system which I followed for the most part. (Vinayagam et al. 2005). This paper used support vector machines, and I thought this would be a good place to start for my project.
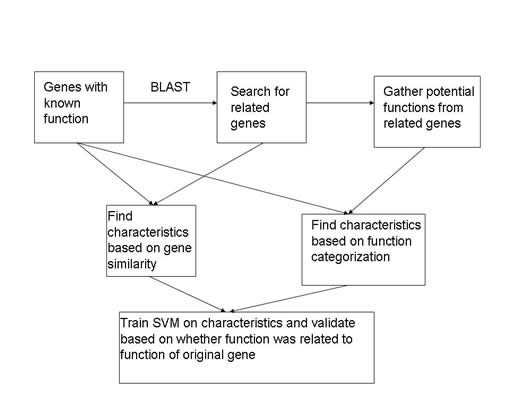
So an overview of what the paper and what I eventually ended up doing to create and train my annotation system using Support Vector Machines. The first step is to gather genes that already have a function assigned to them. This way I can search for similar genes, from those similar genes I can gather functions related to their new genes. These functions now become potential functions for the orginal gene that I did the search with. I can create attributes based on the relationship between the two genes as well as the characteristics of the given function. Once I have the characteristics, I can classify them into a positive class or a negative class for my network based on whether the function that the attributes relate to originally described the original gene.
In order to accomplish my goals there were some major data issues that I needed to deal with. First, I needed to be able to find genomes that had enough function assignments to genes that I could get training data. Second I would need a tool that could search genes for sequence similarity. Finally, I needed to be able to calculate enough attributes in order to have sufficient information to train the SVM. I also needed an SVM program in order to generate a neural network (I looked around and decided that libsvm would be the best tool to use to create my SVM).
I started looking for genomes with annotated GO terms. The GO ontology (see references) is a standardized way to classify protein function. This is helpful, because people often describe function in many different ways. For example, two commonly used terms in function annotation are "translation" and "protein synthesis." These terms mean the same thing, but yet both are used. This is a simple example, but when people assign functions to genes there will be many nuances which would be hard for a computer to determine if two functions are the same or not. Thus, I downloaded known genes and there functions from the GO ontology for well known genomes (Arabidopsis, Worm (C. elegans), Fly (Drosophila melanogaster), Yeast, and Mouse (Mus musculus) ). I then searched their genome databases for all of the genes in the database. It turned out that Arabidopsis has a lot more genes than I wanted to be working with, and the Mouse database was very confusing so I could not find what I needed. Thus, I ended up downloading gene and protein information from the Worm, Fly and Yeast genome ftp servers. Specifically I got the coding regions from the different genomes in fasta form both translated and untranslated.
In order to search the genes against other genes to find similar function I decided to use a program called Basic Local Alignment Search Tool (or BLAST). BLAST is a well known and high used tool in the area of biotechnology and it fit my purposes well. Unfortunately it used a different naming convention than I had obtained from the specific genome databases. I struggled with this, as I could not find an automated way to match up the specific gene names from the organism genome databases and the gene names from the BLAST database. After a while of searching for ways of doing this, I found out that it is possible to create your own search database and tell BLAST to search it instead of the provided ones. This resolved my issue because I could now compile all the protein sequences from the genomes I had collected and make them the search databse. Thus, I was able to decide what names each protein in the database should have. Once I had all this information I used the offline BLAST executables from ncbi. I used the BLAST search blastx to find similarities between each gene from the genomes I had collected and all the protein sequences I had collected.
The blast search gave me lots of similarities to the genes that I searched with. From here it was a matter of parsing the BLAST output and generating attributes based on the genes and there related function. First, I parsed the BLAST output. I was able to generate the BLAST output as xml, so it was relatively simple to parse the information I needed from the searches. From there I started generating attributes:
GO level: The GO classification system is organized in a heirarchy, so this parameter deals with how specific the function term is. Specifically it is the distance from the function term to the root of the graph.
GO path: The GO classification system is organized in a directed cyclic graph which provides many paths to different terms. This attribute deals with how many paths there are from the term to the root of the graph.
Expectation Value: The expectation value is a measure of how probable the similarity between two genes would have occured by change (Generated by BLAST)
Bit score: Another score provided by BLAST to measure similarity
Query coverage score: Combined measure of alignment size and quality concerning the query gene. Calculated by the formula: (Al/Ql) *(I+S) where Al is the alignment length from the BLAST search, Ql is the query sequence length, I is the number of identities between the two sequences, and S is the number of positively contributing residues
Subject coverage score: This is similar to the query coverage score, but is relative to the subject sequence (the found similar gene) rather than the query sequence. Calculated as (Al/Sl) * (I+S), where Sl is the length of the subject sequence.
Query percentage: This is a measure of what percentage of length the alignment was of the query sequence
Subject Percentage: This is a measure of what percentage of length the alignment was of the subject sequence
Query Identity: Percentage of identical residues with respect to the query sequence
Subject Identity: Percentage of identical residues with respect to the subject sequence
Query similarity: Percentage of positively contributing residues with respect to the query sequence
Subject similarity: Percentage of positively contributing residues with respect to the subject sequence
GO frequency (Fg): The frequency that the GO term came up in relation to the searched gene
Number of hits (Tg): The total number of GO terms that came up for a specific gene
Frequency Score: A frequency score to emphasize queries with few hits
Total GO: The total number of GO terms from all hits
Unique GO: The total number of GO terms from all hits, but only counting a term once
Annotation Quality: There were nine other variables for annotation quality. Annotation quality is how the gene function was assigned. Some examples are "Inferred from genetic interaction", "Inferred from Expression pattern", "Traceable Author Statement", "Inferred from Electronic Annotation", etc. There was a 1 for the variable if it was the method used and a 0 otherwise.
Once I had generated these attributes I had to determine whether the attributes were associated with a possitive classification or a negative classification. In order to determine this I checked the gene function versus the gene functions of the original gene. The problem is that the GO ontology is a heirarchy so terms that are parents or children of each other could still be considered the same. I took this into account and searched if the two functions I were checking were related through a parent-child relationship. If they were I determined that this new function would be a correct classification of the gene and therefore classified that group of attributes as +1. If the function wasn't related, the target value for those attributes became -1. Now I was ready for the SVM.
I decided to use libsvm for this assignment because it is a fairly well known and easy way to generate support vector machines. In order to get the data in the right format I had to do some more preprocessing of my data. Since the support vectors took a long time to run, I wanted to check to see if there was any immediate promising results from this. My first BLAST search that finished was the yeast genome so my support vectors were created initially using the yeast genome data for testing and training. Before I did any training I scaled all of my data to between -1 and 1 so to be less skewed by the differences in values among my attributes. When I used a very small training set of 1000 classifications, the resulting support vector machine gave me about a 60% classification rate, but never generated a positive classification. This is definitely not what I wanted, since I wanted to assign gene function and all negatives meant no gene function was ever predicted. To remedy this problem I decided to create training data that had an equal number of negative classifications as positive classifications. This trick seemed to work a little because I got positive classifications. For the training data I got about a 90% classification rate, and on the rest of the data I got about a 70% classification rate. This is very promising because the amount of training data I was using was very small yet I was able to get a pretty good classification rate. I tried using a bigger training set and the problem of getting negative classification went away and I got about 70% classification again. (SVM were created using c=1000, radial basis functions for the kernel function, and gamme = .5)
After these initial techniques I tried to utilize the gridsearch and cross-validation. This approach is a way to determine the optimal parameters for the support vector. As this takes a fairly long time to do, I have not done this with large training data sets yet. Using smaller training data sets the method seems to work about the same as the other two SVMs I described. The method works by trying out all values of C and gamma for the support vector. The method does a cross validation and uses the average classification rate as the judgement of how well the support vector did. Below is a contour plot of the log(C) versus log(gamma). What is plotted on the graph is the average classification rate for the support vector machine with the given parameters.
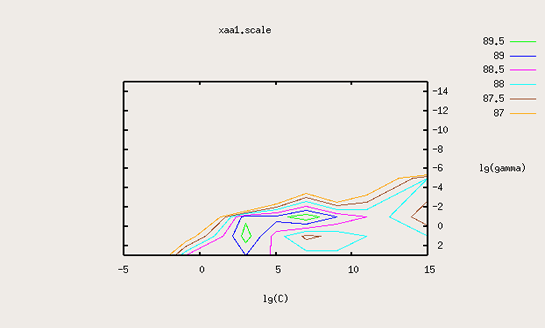
This method generated support vector machines with about the same classification rates as the previous ones I described. While the accuracy might be higher on the training data, this does not carry over to all of the training data.
The last part of my project was to apply my support vector machines accross a genome. Thus, since I already had yeast support vector machines, I tried classifying worm genes using the yeast SVM. This gave me horrible results. Rates of less than 50 % were obtained which is not good. I have not had that much time to explore the possible problems, but I imagine three potential problems. The first is that somewhere along the way in the worm genes, I made a coding mistake which offset the parameters somehow making the SVM act differently than on the yeast genome. Second, it is possible that since there is lack of similarity between yeast, worms, and flies that trying to use one system to predict the other is not a possible thing to do. Finally, I did only use three genomes, and haven't trained on much of the data that I created, so it is possible that the lack of information in my support vector caused some of the classification problems.