Putnam, Norden, Rayleigh Curves
Mark Kampe
1. Introduction
In the 1960s and 1970s, people actively sought ways to mathematically
predict the time and cost of a project as a function of the requirements
and other parameters of the problem. The most advanced fruit of these
efforts was Barry Boehm's COnstructive COst Model. While the formulae
derived in those efforts are not (today) widely used, there is still
value in understanding the relationships they capture.
This paper is a brief introduction to (and commentary on)
Putnam, Norden, Rayleigh (PNR) curves and what they tell
us about project staffing.
2. Staffing and the Rayleigh Curve
It is very natural for a project manager to want to:
- figure out how many people will be needed to complete a project.
- assign them to it.
- divide the number of estimated staff months by the head-count
to get an expected completion time.
Sadly, this isn't how it works:
- Peter Norden (of IBM, in 1963) observed that a project is
not a single monolithic activity, to be accomplished by a
single team. Rather, it is a sequence of distinct but
overlapping phases, each of which has is own natural
team size and composition.
- Frederick Brooks (in the Mythical Man Month) pointed out
that time and man-power are not interchangeable because
team size and composition affect productivity.
Every project actually has a natural staffing curve, and
these curves seem to have a consistent and predictable shape.
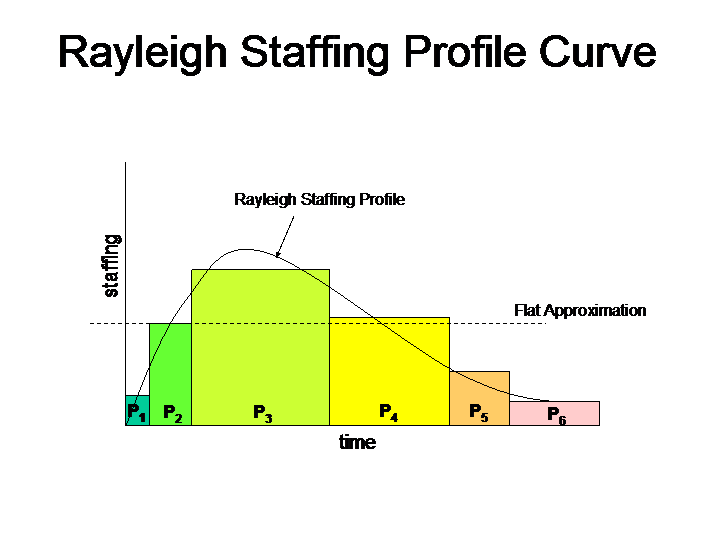
We can attempt to force a flat staffing profile on such a project,
but it will result in considerable waste:
- In the early stages, there will be people standing around
with nothing to do, because the requirements and architecture
development process is more gated by time than by labor.
- In the mid stages, work may be delayed by not having enough
people available to perform all of the defined tasks.
- In the late stages, over-staffing will not bring the
project to completion any sooner, because the collection
of feedback and shaking out of final problems is (again)
more gated by time than available labor.
If we want to accomplish a project efficiently, we much understand
the distinct phases, along with their respective skill and activity
requirements. The notion that we can prepare an estimate in staff
months and predict completion time by choosing a staffing level and
dividing that into the total project size is a canard.
3. Time/Effort and the PNR Curve
Lawrence Putnam (of RADC) applied Norden and Rayleigh's work to
the effort to quantitatively predict the work associated with
software projects. After studying numerous projects, he concluded
that the effort required to deliver a project varied inversely as
the fourth power of the time allotted to its completion.
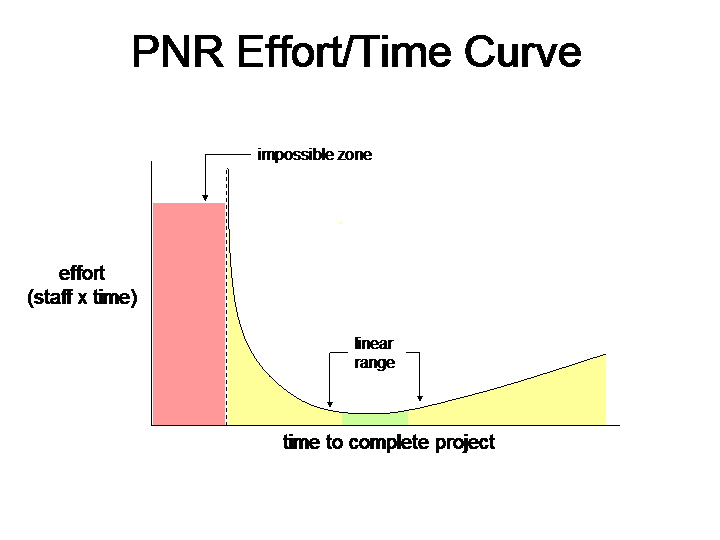
The clear message here is that every project has an optimal
staffing level, and (correspondingly) an optimal time in which
it will be completed. Going significantly above or below the
optimal staffing level will reduce work efficiency ... and there
may be a point beyond which adding people actually delays the project.
This curve breaks down into four zones:
- An impossible zone
The project cannot be accomplished in less time than this,
no matter how many people are applied to the problem.
This situation is classically summarized as:
"Nine women cannot have a baby in one month".
- An "Haste makes waste" zone
Adding people does accelerate delivery, but not in
proportion to the added effort.
Each additional person added to the project lowers our
productivity (they have to be trained, more time goes
into communication and coordination, more misunderstandings).
This is a very inefficient way to operate.
- A linear range
This is the range of efficient staffing, and within this range
it is possible to trade man-power for time, or vice versa.
- An under-staffed/over-staffed zone
This curve does not yield completion time as a function
of staffing, but merely shows the relationship between
staffing level and completion times. What we can clearly
see on the right of the curve is that productivity is
dropping. Why might this be?
- If the project is critically under-staffed, productivity
will suffer because there aren't enough people to deal
with the problems.
- if the project is greatly over-staffed communications
overhead will reduce efficiency and misunderstandings will
create problems and result in wasted work.