Based on a combination of innate cynicism and having made some very good purchases during recessions, I have been disinclined to buy much in the past few years. But it has become apparent to me that waiting for a 25% drop has caused me to miss 50% gains. These simulations are an effort to moderate my instincts with data.
The distributions are wide and the standard deviations are, in many interesting cases, approach the mean values. There are clearly no guarantees, and results are much more dependent on the market than strategy.
The S&P500 data I used had only monthly data. This likely under-estimates the performance of both Bottom and Dip buying, as the actual bottoms are unlikely to have ocurred on the first of a month.
I chose to base my simulations on 1950-2020 data (wanting to skip the depression and WW II) It could be argued that the next twenty years will be fundamentally unlike the last seventy.
I ran each of these strategies against a large number of actual market histories (20 year snippets starting at various times), plotted the distribution of results, and reported the measured means and standard deviations. The resulting distributions and statistics are below. My attempted summary of these results and their lessons is:
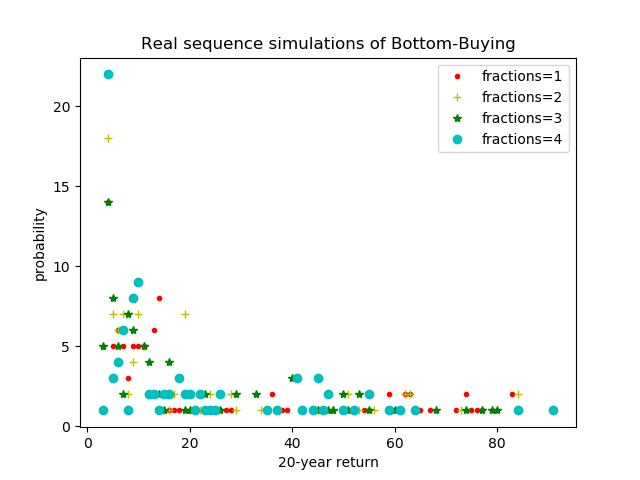
It should be noted that the Bottom-Buying implementation is not a real strategy, as it inspected the entire 20 years before deciding when to buy. Like the Sterling Engine, it is only included as a bench mark against which other (possible) strategies could be evaluated.
The training data is thin, and all results had high standard deviations, but to the extent that these results can make recommendations, the best strategy might be:
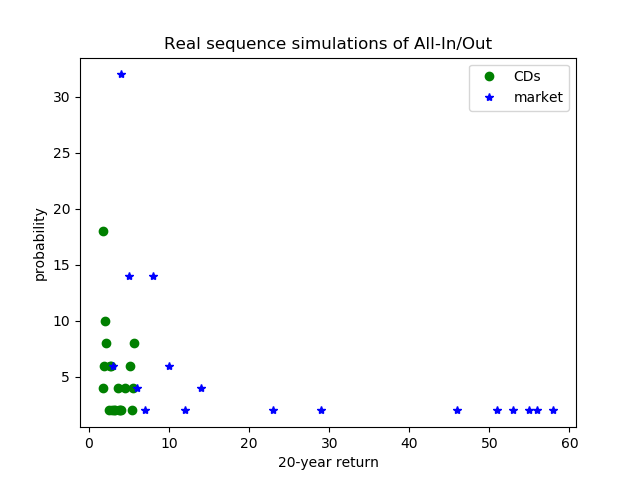
CDs, 20 years mean=$4,121, sigma=$1,600, return= 7.33%/y market, 20 years mean=$9,985, sigma=$6,161, return=12.19%/y
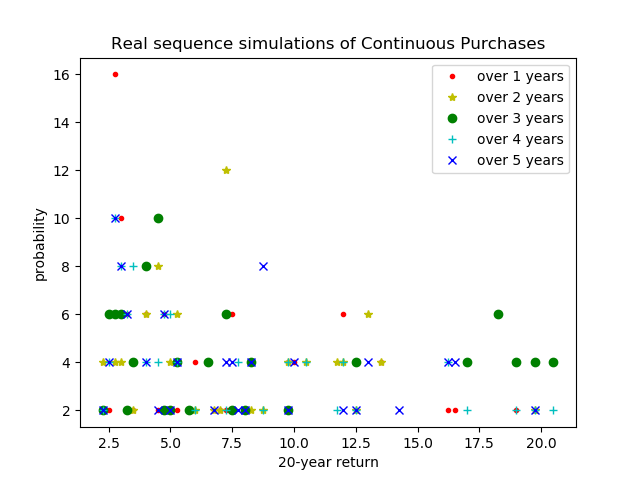
over 1 years: mean=$6,743, sigma=$4,282, return=10.01%/y over 2 years: mean=$5,436, sigma=$2,910, return=8.83%/y over 3 years: mean=$4,997, sigma=$2,460, return=8.37%/y over 4 years: mean=$4,778, sigma=$2,239, return=8.13%/y over 5 years: mean=$4,647, sigma=$2,108, return=7.98%/y
in 1 pieces: mean=$10,153, sigma=$6,180, return=12.28%/y in 2 pieces: mean=$10,107, sigma=$6,149, return=12.26%/y in 3 pieces: mean=$10,051, sigma=$6,114, return=12.23%/y in 4 pieces: mean=$ 9,993, sigma=$6,068, return=12.19%/y
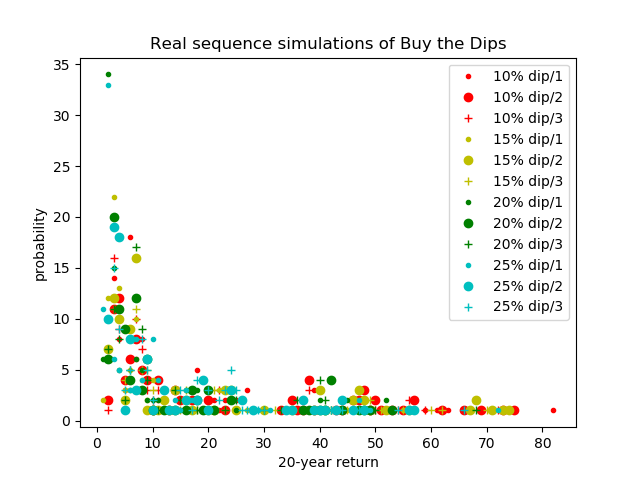
10% dip/1: mean=$ 9,406, sigma=$ 6,974, return=11.85%/y 10% dip/2: mean=$19,269, sigma=$14,853, return=15.94%/y 10% dip/3: mean=$39,070, sigma=$31,924, return=20.11%/y 15% dip/1: mean=$ 9,576, sigma=$ 7,520, return=11.95%/y 15% dip/2: mean=$19,855, sigma=$15,580, return=16.11%/y 15% dip/3: mean=$40,466, sigma=$34,064, return=20.32%/y 20% dip/1: mean=$ 8,006, sigma=$ 4,962, return=10.96%/y 20% dip/2: mean=$20,181, sigma=$16,334, return=16.21%/y 20% dip/3: mean=$42,827, sigma=$37,344, return=20.66%/y 25% dip/1: mean=$ 8,416, sigma=$ 4,915, return=11.23%/y 25% dip/2) mean=$21,233, sigma=$17,478, return=16.50%/y 25% dip/3: mean=$44,423, sigma=$38,633, return=20.88%/y