|
|
(linked!)
Here are the in-class examples and slides
In particular, that file includes some examples of the neuralnet
and ksvm and knn functions -- that can be used to build predictive
models in a variety of ways...
As usual, for this assignment, please submit a zipped folder named hw8.zip
that contains a few files: one named pr1.txt that includes
your interactive session (or history)
working through Chapter 15 of the Data Science book, which uses
some of the location-data facilities in R (though, admittedly, only a small fraction
of what GIS systems handle!)
The second part of the assignment asks you to decide on a final-project dataset
and to access that data through R by (1) plotting a couple of visualizations and
(2) creating at least one Support Vector Machine, at least one Neural Network, and
at least one k-Nearest Neighbors model from the data.
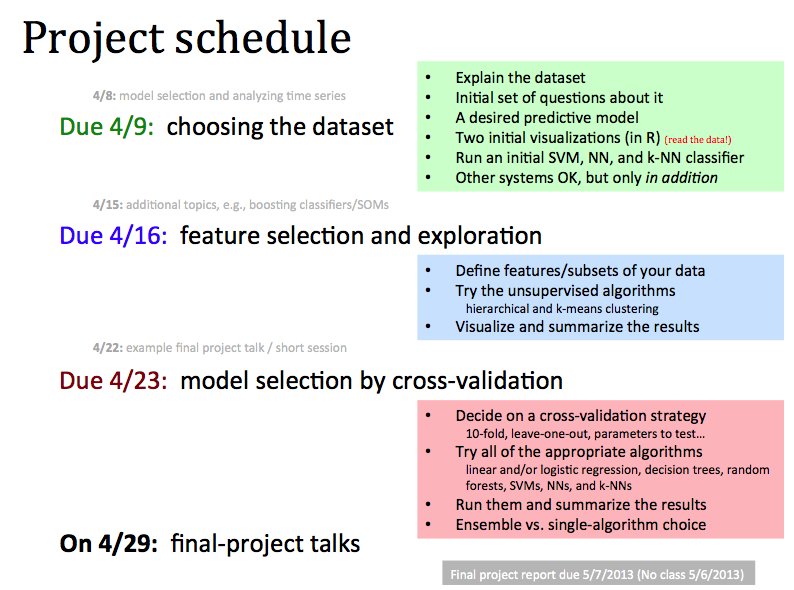
Here is a week-by-week schedule of deliverables for that project, including
some ideas for datasets, if you don't have data from another project you'd like
to analyze...:
-
Due 4/9/2013
By this date, you should have decided on a dataset for your IST380 final
project. I would encourage you to use a dataset that you already have
as part of another project or an ongoing interest. However, if you don't
have any particular favorite data, there are many all over the web.
Here are some possibilities to inspire your search for something you like:
For this week, include a Microsoft word document that
- describes your data set in a few sentences
- indicates its context -- perhaps where it comes from and why it's of interest
- suggests a few (let's say at least three...) questions that you'd be interested
in investigating using this dataset
- include the whole dataset if it's not too huge...
- Also, include two R-produced visualizations of the data (mostly just to
show that you can access the dataset through R!)
- Finally, include an example predictive model from your dataset using
SVMs, NNs, and k-NN. It does not have to be carefully designed -- but this is
just to show that you can build models using your data (and can use those algorithms!)
- For the final version of the final project, other analysis tools,
such as SAS, SPSS, ArcGIS, etc.. are all welcome!
However, at least some of your analysis needs to use R, as noted above.
For the moment, I'm going to include this slide image as a summary of
upcoming deliverables (and class topics...):
|