Identifying Bias in Data using Two-Distribution Hypothesis Tests
2021
Overview
Imagine you're flipping a coin you presume to be fair. You flip it 20 times and see the sequence
$$H T T H T T H H H H H T H T H T H H T H.$$
Nothing immediately stands out to you, so you never question whether the coin is fair or not. But imagine you flipped that same coin and saw the sequence
$$H H H H H H H H H H H H H H H H H H H H.$$
You'd immediately suspect something was up. More specifically, you'd almost assuredly say that the coin was unfairly weighted towards heads. But how did you come to this conclusion? Was it based on probability alone? If the coin was truly fair, both of the heads-tails sequences above have exactly a \(1/2^{20}\) chance of happening, so what makes you suspicious of the second sequence?
Humans are pretty good at recognizing patterns, and that very pattern recognition probably gave you a hint that a weighted coin generated the second sequence. It wasn't just the low probability of that specific sequence occurring that raised your eyebrows. It was also that sequence's conformity to some pattern. Our team is interested in making use of these two factors, probability and conformity, to analyze machine learning training data, and identify the potentially biased processes that could have generated them.
Bias in Artificial Learning
Artificial intelligence (AI), and specifically machine learning (ML) techniques, have become wildly popular in the past decade for making all kinds of applications from voice assistants to TV show recommendations. In many cases, the faults of an algorithm may not have any sort of meaningful impact. Perhaps you'll have to suffer from a bad Netflix recommendation, but nothing more. However, ML algorithms are also used to make much more important decisions, like whom to hire at a company or whom to grant a loan to. In these cases, any undesirable behavior of the algorithm, such as favoring one group over another, will have major consequences. In fact, a few years ago, Amazon had to scrap an entire recruiting tool because it exhibited bias against female applicants.
How can such behavior arise? Algorithms learn from training data, bundles of information about thousands of different people or scenarios along with the correct decision for that datapoint. For a hiring algorithm, this might be information from the applicant's resume, some demographic information, and a record of whether they were hired or not. However, if that training data had a disproportionate amount of white males, for example, the algorithm may pick up on that and unjustly favor those kinds of applicants over others. As such, the issue of both identifying and eliminating bias in training data has garnered a massive amount of attention in recent years, and we hope to contribute to the identification side of this using statistical hypothesis testing.
Project Background
Statistical hypothesis tests allow people to probabilistically rule out a proposed hypothesis as an explanation for a given dataset. For example, a binomial test could be used to test the hypothesis that our coin in the previous example was fair. Such hypothesis tests work by generating a \(p\)-value, the probability that the observation (or a more extreme result) would occur under the proposed hypothesis. Typically, if this \(p\)-value is less than some chosen significance threshold alpha, then we reject the null hypothesis. Otherwise, we fail to reject it.
Several popular hypothesis tests, such as binomial, chi-squared, and Student's t, are widely used for testing the plausibility of null hypotheses. Some of these could be applicable for identifying bias in machine learning training data. Say a company, like the one in the previous section, wanted to train an algorithm to automate their hiring process. They would want to be able to feed this algorithm an applicant's demographic information, background, and qualifications and have it return a result of "hire" or "not hire". In order to train this model, they decide to use their current and past hiring records, where each current or past applicant has an information profile, and a binary label of "hired" or "not hired". Unfortunately, the company suspects that their historical hiring records might be unjustly biased towards white applicants. Here we take bias to be deviation from some proposed unbiased explanation. In this case, the unbiased explanation is that racial demographics of the hired employees of the company match that of the entire pool of applicants, so no favor is shown to one race over another in the hiring process. A statistical hypothesis test (specifically a chi-squared test in this case) could be used to determine whether this unbiased explanation would plausibly explain the demographics of the hired applicants. By plausible, we mean that the hypothesis was not rejected by the test, not necessarily that the hypothesis has a "high" chance of producing the data.
While all the hypothesis tests mentioned above are useful, all of them assume that sequences are generated under a particular known distribution. This distribution is usually just the name of the test. For a chi-squared test, we assume a chi-square distribution. Additionally, these tests can tell you whether or not the proposed hypothesis could plausibly explain the data, but unfortunately do not provide any further insight. In many cases, if someone's proposed hypothesis was rejected, they would probably be interested in answering the question of what hypothesis would not be rejected. For the company mentioned above, if their proposed unbiased explanation was rejected, they may wonder what explanation(s) would not be rejected, and how close their proposed hypothesis was to such an explanation.
That's where our research comes in. Previous work from our lab has generated a novel hypothesis test that resolves the issues discussed above. We extend this work and show useful, real-world applications of this technology for industry use.
Key Definitions and Methodology
Define the kardis \(\kappa(x)\) of event \(x\) as
$$\kappa(x) := r\frac{p(x)}{\nu(x)}.$$
where \(p(x)\) is the probability of observing \(x\) under probability distribution \(P\) (which represents the null hypothesis), \(\nu(x)\) is the specificity (conformity to a pattern) of \(x\) by some predetermined notion of structure, and \(r\) is a normalizing constant. Notice that this formulation of \(\kappa(x)\) captures both the probability and conformity of an event as discussed earlier.
With this in mind, our lab has shown that for some chosen significance level \(\alpha\)
$$\Pr(\kappa(x) \leq \alpha) \leq \alpha.$$
Thus, we can reject a proposed hypothesis \(P\) if \(\kappa(x) \leq \alpha\). Furthermore, it has also been shown that in order for any new hypothesis to not be rejected by our test, it must boost \(p(x)\), the probability of observing \(x\), by at least a factor of
$$s = \frac{\alpha\nu(x)}{rp(x)}.$$
This bound is the key to our results, since it means that a proposed probability distribution (explanation) \(Q\) must give at least
$$q(x) \geq sp(x)$$
probability to \(x\) in order to not be rejected by our hypothesis test.
Most importantly, this bound allows us to find the "closest plausible explanation" for the data in the case that the original proposed hypothesis is rejected by solving a constrained optimization problem. In other words, if a proposed hypothesis is rejected, we can say that the true explanation would have to be biased by at least a certain amount. This gives our test a unique degree of clarity, since it allows users to get a better sense of what hidden biases might be present in the processes that created their data.
It should be stated clearly that we are not making claims about bias of any particular machine learning algorithm, or even identifying algorithmic bias at all. Rather, we seek to uncover biases in the processes that generate training data, like hiring practices or weighted coins.
Selected Results
We tested our methods on three real-world datasets, two of which will be shown here. The first dataset we tested for bias in was the publicly available COMPAS (Correctional Offender Management Profiling for Alternative Sanctions) dataset which was used to train the COMPAS algorithm. The algorithm's purpose was to assign defendants in court a risk score for recidivism (tendency to reoffend), and it remains a popular tool for judges and parole officers.
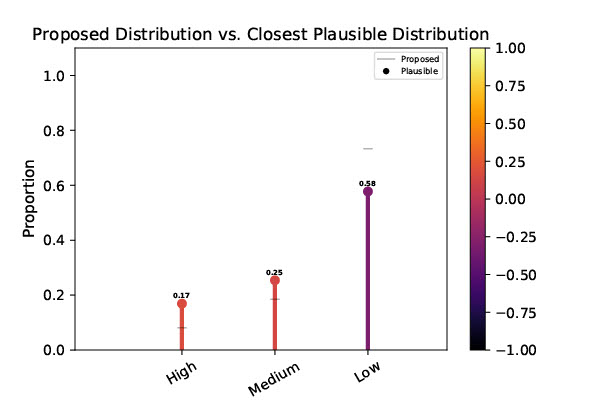
It is already well known that the algorithm is biased against Black defendants, consistently giving them unjustly high recidivism scores compared to Caucasians. Our contribution is quantifying the bias in the training data itself, and returning a closest feasible explanation for this bias. First, we took the proportion of Caucasians assigned to the three possible categories: low, medium, and high risk. Since the data is supposed to be fair, we use these proportions as the null hypothesis to test for bias in the Black population. That is, could the same process that generated the Caucasian proportions plausibly have generated the proportions of Black people assigned to each category?
As expected, the null hypothesis was rejected at the \(\alpha = 0.05\) significance level, with a \(\kappa(x)=2.4272 \times 10^{-683}\). Furthermore, we found that the closest plausible explanation for the data shows Black people having roughly double the probability of being categorized as “high risk” than Caucasians, which is illustrated in the graph below. The colors of the lollipop bars representing the closest plausible distribution correspond to how far away they are from the proposed distribution, with a heatmap key on the right.
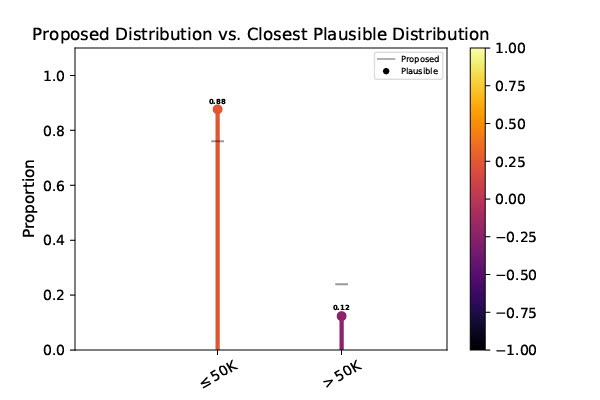
We also tested the UCI Adult dataset which contains a variety of demographic information for over 40,000 people, with a binary label of whether they make more or less than $50,000 per year. If the process that generated dataset is fair in the traditional sense of the word, then it should have an equal chance of putting a woman in the “≤50K” category as a male. As such, we used the proportion of men labeled “≤50K” (about 0.76) as our null hypothesis and tested the subset of only women for deviation from this proportion. Again, the null hypothesis was rejected at the \(\alpha = 0.05\) significance level, with \(\kappa(x)=2.2022 \times 10^{-254}\). The closest plausible distribution is illustrated below, showing that the nearest plausible explanation gives women an 88% chance of being assigned to the “≤50K” group, which is clearly biased from the null hypothesis of 76%. Remember, we are not making statements about any algorithm, but rather a potential process that could have lead to the given labels in the dataset. In this case, that process would be a wide swath of real societal factors, including gender discrimination.
Our hypothesis tests also have some significant benefits compared to existing methods, which we hope will make them fit for industry applications.
- Unlike other tests in the literature, our tests can handle compound hypotheses. That is, they can reject whole sets of hypotheses, rather than just one at a time.
- They are fast and tractable. Even for datasets consisting of 100,000 entries and 10 labels, our tests can run in under 10 minutes on a consumer-level laptop. This contrasts other tests in the literature which appear to need enormous compute power.
- With our tests, there is no need to know the behavior of the underlying probability distribution \(P\) in advance, only the probability \(p(x)\) for the singular event \(x\). This distinguishes our tests from many common hypothesis tests (chi square, binomial, etc.) which assume a distribution's shape.
Additional Resources
Authors


Acknowledgements
This research was supported in part by the National Science Foundation under Grant No. 1950885. Any opinions, findings, or conclusions are those of the authors alone, and do not necessarily reflect the views of the National Science Foundation.
Further Reading
- Montañez, G. D. (2018). A Unified Model of Complex Specified Information. BIO-Complexity, 2018.
- Hom, C., Maina-Kilaas, A. R., Ginta, K., Lay, C., and Montañez, G. D. (2021, February). The Gopher's Gambit: Survival Advantages of Artifact-based Intention Perception. In ICAART (1) (pp. 205—215).
- Jiang, H., and Nachum, O. (2020, June). Identifying and Correcting Label Bias in Machine Learning. In International Conference on Artificial Intelligence and Statistics (pp. 702—712). PMLR.
- Taskesen, B., Blanchet, J., Kuhn, D., and Nguyen, V. A. (2021, March). A statistical test for probabilistic fairness. In Proceedings of the 2021 ACM Conference on Fairness, Accountability, and Transparency (pp. 648—665).